Attendance Matters – A Look at What the Data says
Attendance Impacts Test Scores
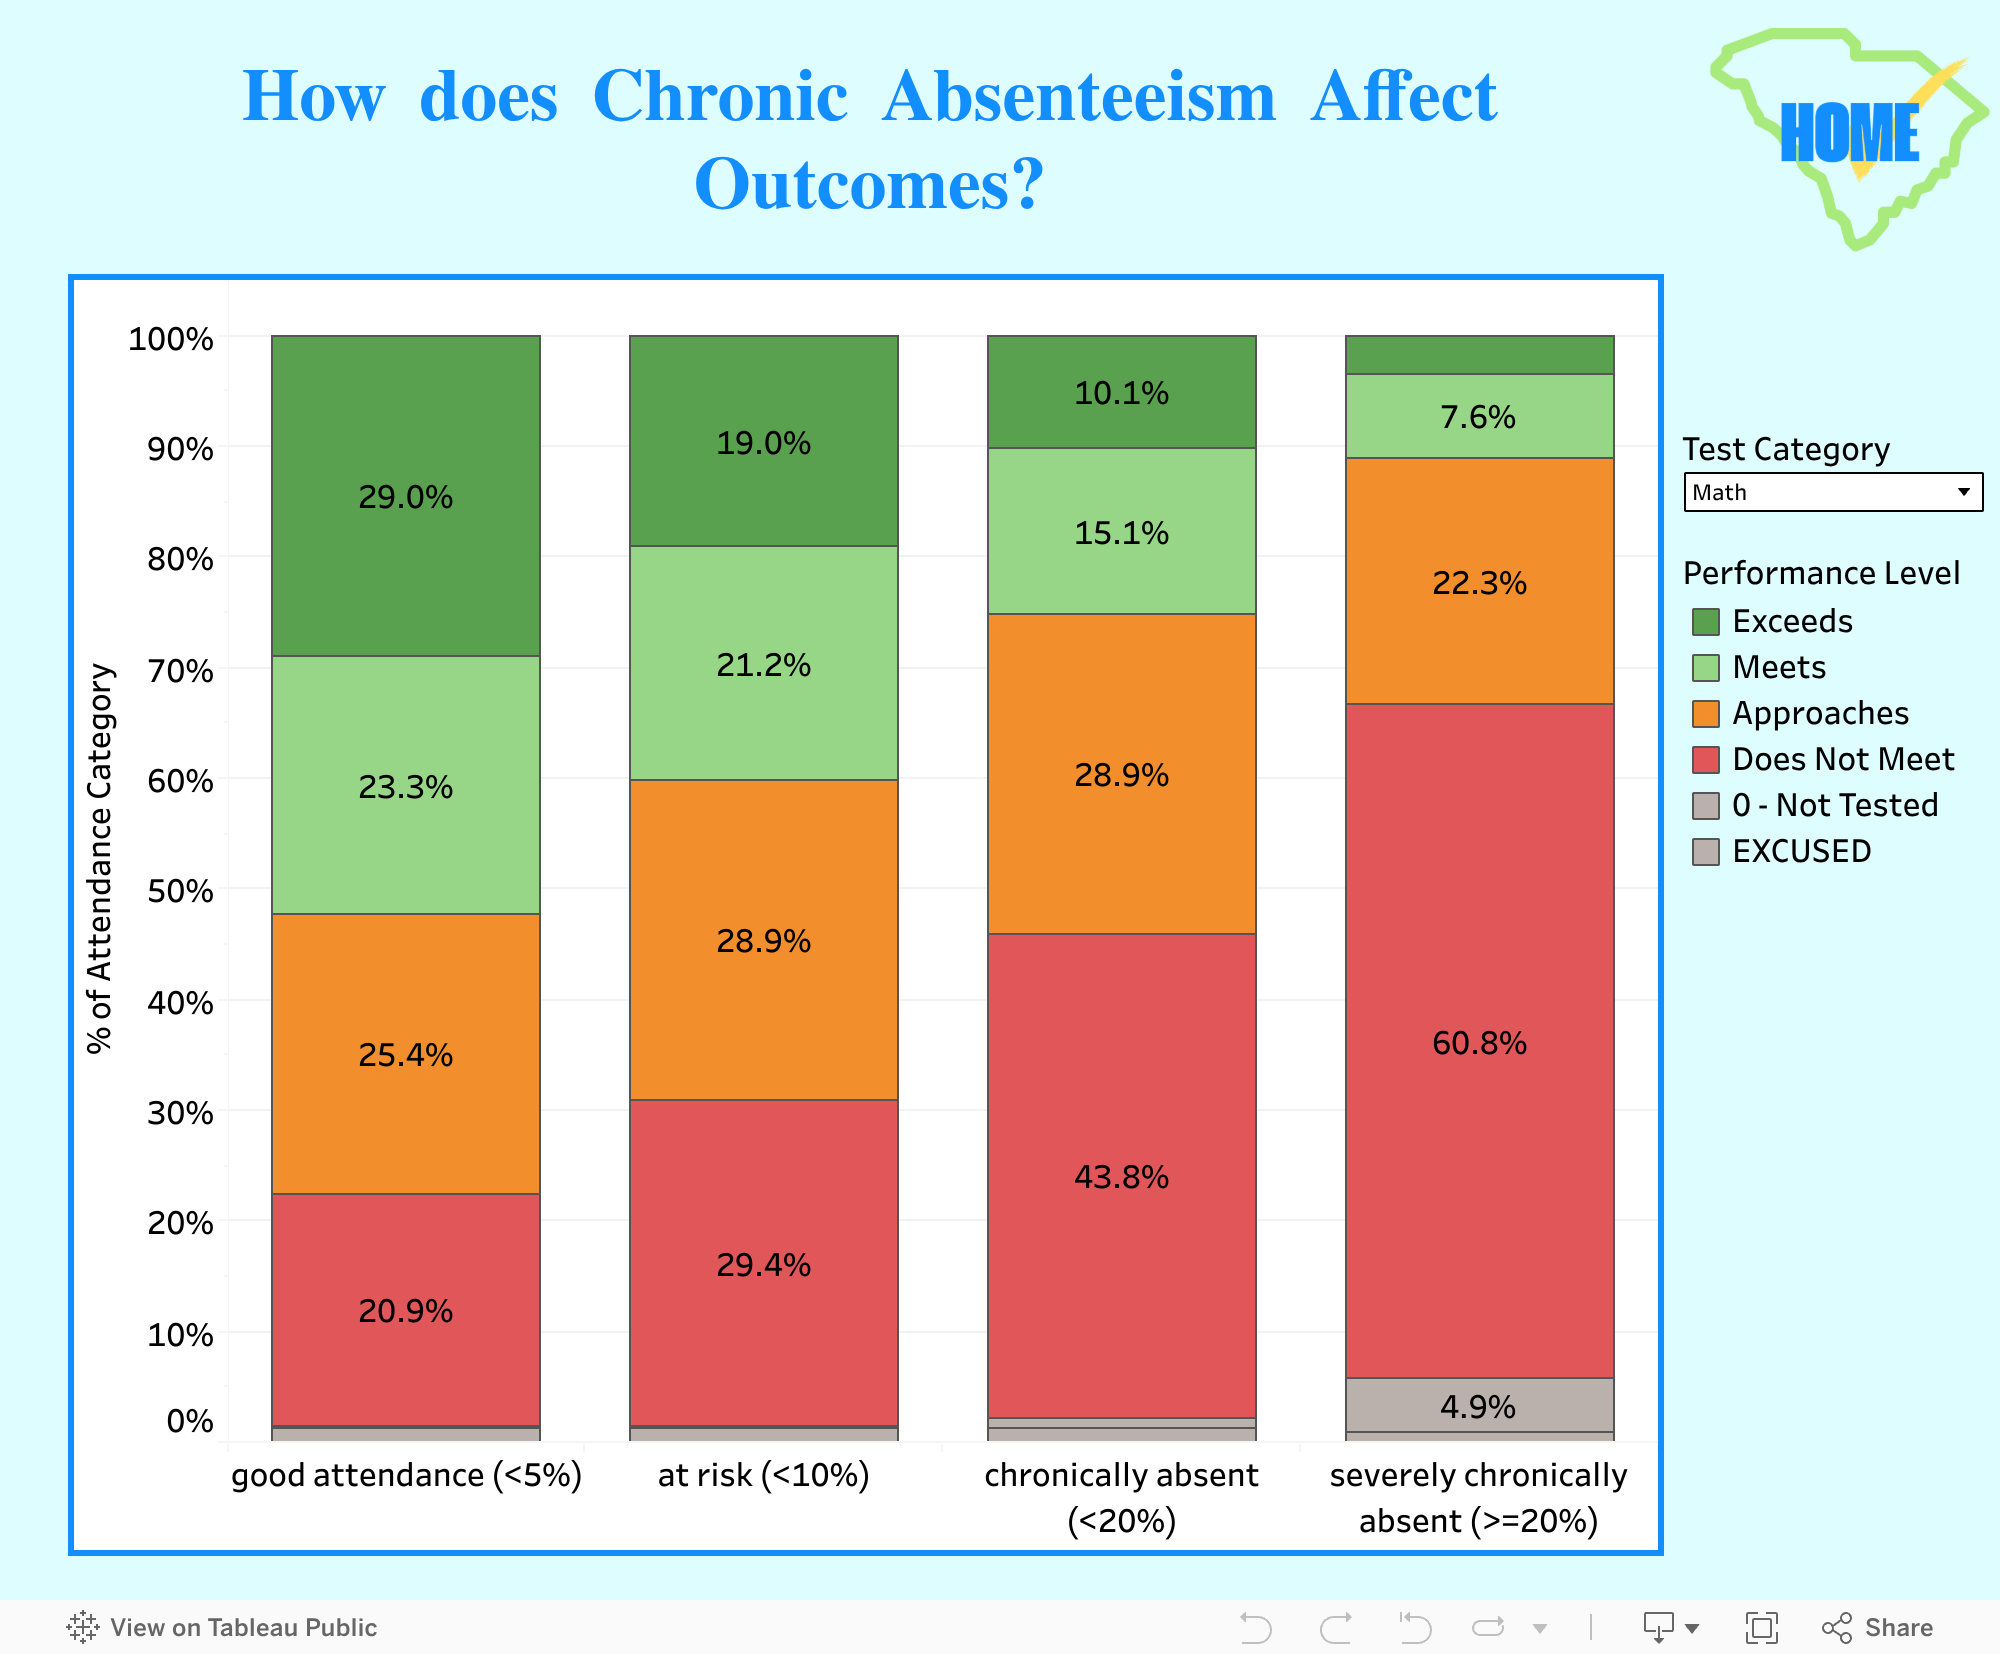
EOC staff looked at the relationship between attendance and test scores from a sample of 493,609 public school students in South Carolina – 3rd through 12th graders – during the 2023-2024 school year.
The impact of attendance on 3rd to 8th grade testing is reflected in the interactive dashboard illustrating ELA and Math scores.
The impact of attendance on 9th to 12th grade testing is reflected in the chart showing End of Course Biology I and End of Course US History & Constitution scores.